诡异问题定位始末—-clock_gettime造成系统整体负载过高 问题背景 有一台linux服务器测试环境cpu经常到达80%,造成系统卡顿,部分功能不可用.
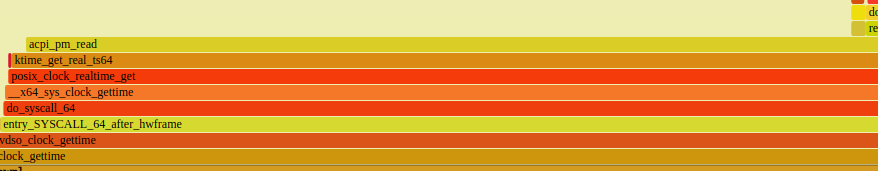
分析步骤 1.使用perf制作cpu火焰图 通过制作cpu火焰图,发现很多进程都存在大量的clock_gettime系统调用.
2.进一步查看clock_gettime的调用次数 1 2 3 4 5 6 7 8 9 10 11 12 13 14 15 16 17 18 19 20 21 22 23 24 25 26 27 28 29 root@10003:~# /usr/share/bcc/tools/funclatency '*clock_gettime*' -d 30 Tracing 6 functions for "*clock_gettime*"... Hit Ctrl-C to end. nsecs : count distribution 0 -> 1 : 0 | | 2 -> 3 : 0 | | 4 -> 7 : 0 | | 8 -> 15 : 0 | | 16 -> 31 : 0 | | 32 -> 63 : 0 | | 64 -> 127 : 0 | | 128 -> 255 : 0 | | 256 -> 511 : 0 | | 512 -> 1023 : 0 | | 1024 -> 2047 : 413453 |**** | 2048 -> 4095 : 1815900 |******************** | 4096 -> 8191 : 3576475 |****************************************| 8192 -> 16383 : 2350047 |************************** | 16384 -> 32767 : 405074 |**** | 32768 -> 65535 : 28429 | | 65536 -> 131071 : 9908 | | 131072 -> 262143 : 631 | | 262144 -> 524287 : 248 | | 524288 -> 1048575 : 58 | | 1048576 -> 2097151 : 128 | | 2097152 -> 4194303 : 1707 | | 4194304 -> 8388607 : 2 | | avg = 7966 nsecs, total: 68529765602 nsecs, count: 8602313
怎么样?是不是很夸张,30s内调用了近千万次,耗时也很可观.
3.因为还有其它环境负载类似,因此对比了另外一个环境的情况 1 2 3 4 5 6 # /usr/share/bcc/tools/funccount "*clock_gettime*" -d 10 Tracing 6 functions for "*clock_gettime*"... Hit Ctrl-C to end. FUNC COUNT __x64_sys_clock_gettime 334 Detaching...
!!!这根本不是一个量级好吧?为什么异常的服务器会多出如此多的系统调用呢?
4.进一下分析clock_gettime的实现原理 4.1 系统调用 系统调用需要从用户态切换到内核态,因此相对开销较大,为了优化频繁调用的函数的开销,linux使用了vdso机制.
vdso原理
4.2 哪些函数可以使用vdso 1 2 3 4 5 6 7 8 9 10 x86-64 functions The table below lists the symbols exported by the vDSO. All of these symbols are also available without the "__vdso_" prefix, but you should ignore those and stick to the names below. symbol version ───────────────────────────────── __vdso_clock_gettime LINUX_2.6 __vdso_getcpu LINUX_2.6 __vdso_gettimeofday LINUX_2.6 __vdso_time LINUX_2.6
4.3 clock_gettime为什么是系统调用 既然clock_gettime可以通过vdso,为什么异常系统上还会有这么多系统调用呢?
4.4 根因 时间相关的几个函数与系统时钟源密切相关,linux启动时会根据精度和开销选取最佳时钟源.
下文是关于时钟源的说明:
1 2 3 4 5 6 7 内核在启动过程中会根据既定的优先级选择时钟源。优先级的排序根据时钟的精度与访问速度。 其中CPU中的TSC寄存器是精度最高(与CPU最高主频等同),访问速度最快(只需一条指令,一个时钟周期)的时钟源,因此内核优选TSC作为计时的时钟源。其它的时钟源,如HPET, ACPI-PM,PIT等则作为备选。 但是,TSC不同与HPET等时钟,它的频率不是预知的。因此,内核必须在初始化过程中,利用HPET,PIT等始终来校准TSC的频率。如果两次校准结果偏差较大,则认为TSC是不稳定的,则使用其它时钟源。并打印内核日志:Clocksource tsc unstable. 正常来说,TSC的频率很稳定且不受CPU调频的影响(如果CPU支持constant-tsc)。内核不应该侦测到它是unstable的。但是,计算机系统中存在一种名为SMI(System Management Interrupt)的中断,该中断不可被操作系统感知和屏蔽。如果内核校准TSC频率的计算过程quick_ pit_ calibrate ()被SMI中断干扰,就会导致计算结果偏差较大(超过1%),结果是tsc基准频率不准确。最后导致机器上的时间戳信息都不准确,可能偏慢或者偏快。 当内核认为TSC unstable时,切换到HPET等时钟,不会给你的系统带来过大的影响。当然,时钟精度或访问时钟的速度会受到影响。通过实验测试,访问HPET的时间开销为访问TSC时间开销的7倍左右。如果您的系统无法忍受这些,可以尝试以下解决方法: 在内核启动时,加入启动参数:tsc=reliable
tsc是最优时钟源,当使用它时,时间相关函数可以通过vdso实现,而当退化而使用其它时钟源时,就需要走真正的系统调用了.那么,我们系统上是这种情况吗?
dmesg查看到如下输出:
1 2 3 4 5 6 7 # dmesg | grep clock [ 3007.005852] clocksource: timekeeping watchdog on CPU0: Marking clocksource 'tsc' as unstable because the skew is too large: [ 3007.005853] clocksource: 'acpi_pm' wd_now: 13f3cd wd_last: f657df mask: ffffff [ 3007.005854] clocksource: 'tsc' cs_now: 96685727fda cs_last: 95aef19df08 mask: ffffffffffffffff [ 3007.005854] tsc: Marking TSC unstable due to clocksource watchdog [ 3007.006767] sched_clock: Marking unstable (3006972692137, 33974437)<-(3007014491200, -7725623) [ 3007.007138] clocksource: Switched to clocksource acpi_pm
tsc: Marking TSC unstable due to clocksource watchdog可以看到确实如此,tsc已经被抛弃了
因此,有问题的系统上由于tsc失效,时间相关函数由vdso退化为系统调用,造成系统负载过高.
发现有前辈也遇到类似问题,分析更细致
解决方法 修改/etc/default/grub配置tsc:
1 GRUB_CMDLINE_LINUX="... clocksource=tsc tsc=reliable"